Explore and OQL
Explore is the scratchpad for OQL, Oriel’s pipeline query language. Use it when you need to inspect telemetry before saving a query, pinning a dashboard panel, or creating an alert.
Query from scope
Section titled “Query from scope”- Select a workspace, project, environment, service, and time range.
- Open Explore.
- Start with one source:
spans,traces,logs,metrics, orprofiles. - Add pipeline stages such as
where,stats,fields,sort,top, andlimit. - Save useful queries or pin panels to dashboards.
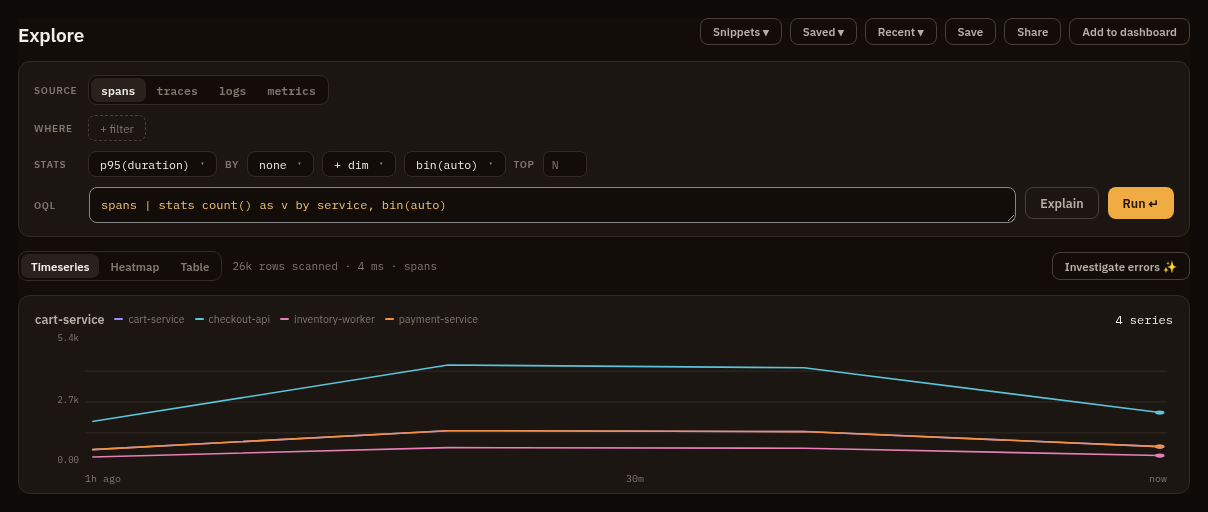
Examples:
spans | where duration > 250ms | stats p95(duration), count() by http.routelogs | where severity >= warn and body contains "timeout" | limit 200metrics | where name == "http.server.duration" | stats p95(value) by service, bin(5m)Permissions
Section titled “Permissions”Explore requires telemetry:query. Saving queries requires queries:manage.
Pinning results to a dashboard requires dashboards:manage.
Pivots
Section titled “Pivots”- Open a trace result in Trace Detail.
- Open logs near a selected trace or span.
- Use a service value as the active service scope.
- Move a query into a dashboard panel when it should be monitored repeatedly.
Use OQL query patterns for copyable examples and the OQL reference for the closed syntax and field sets.