Metrics
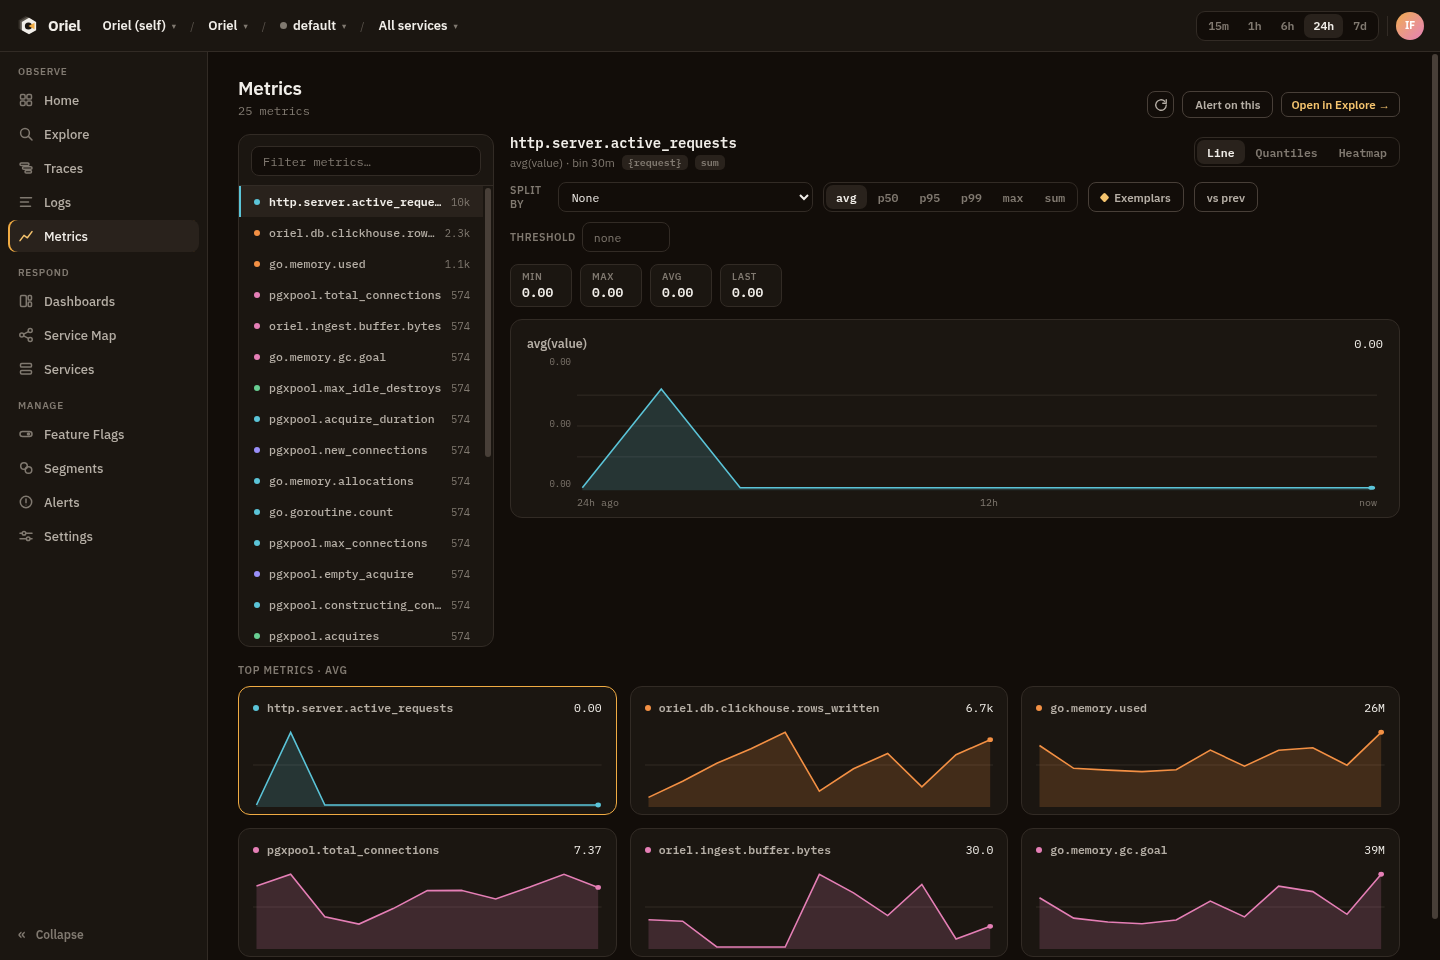
Use metrics to inspect rates, gauges, distributions, and service trends.
Workflow
Section titled “Workflow”Open Metrics or Explore and start with the metrics source.
Examples:
metrics | where name == "http.server.duration" | stats p95(value) by service, bin(auto)metrics | where name == "process.runtime.go.goroutines" | stats max(value) by servicemetrics | where temporality == "cumulative" | fields time, name, service, value, unitMetric rows expose instrument context such as point_kind, temporality,
is_monotonic, unit, scope_name, and scope_version.
Permissions
Section titled “Permissions”Metrics require telemetry:query.
Related Pivots
Section titled “Related Pivots”- Use exemplars to pivot from a metric point to a trace when exemplar data is present.
- Pin stable metric queries to dashboards.
- Use service filters to compare a metric across environments.
- Convert threshold-style metric queries into alert rules.