Traces
Use traces to understand request paths, latency, errors, and service boundaries.
Workflow
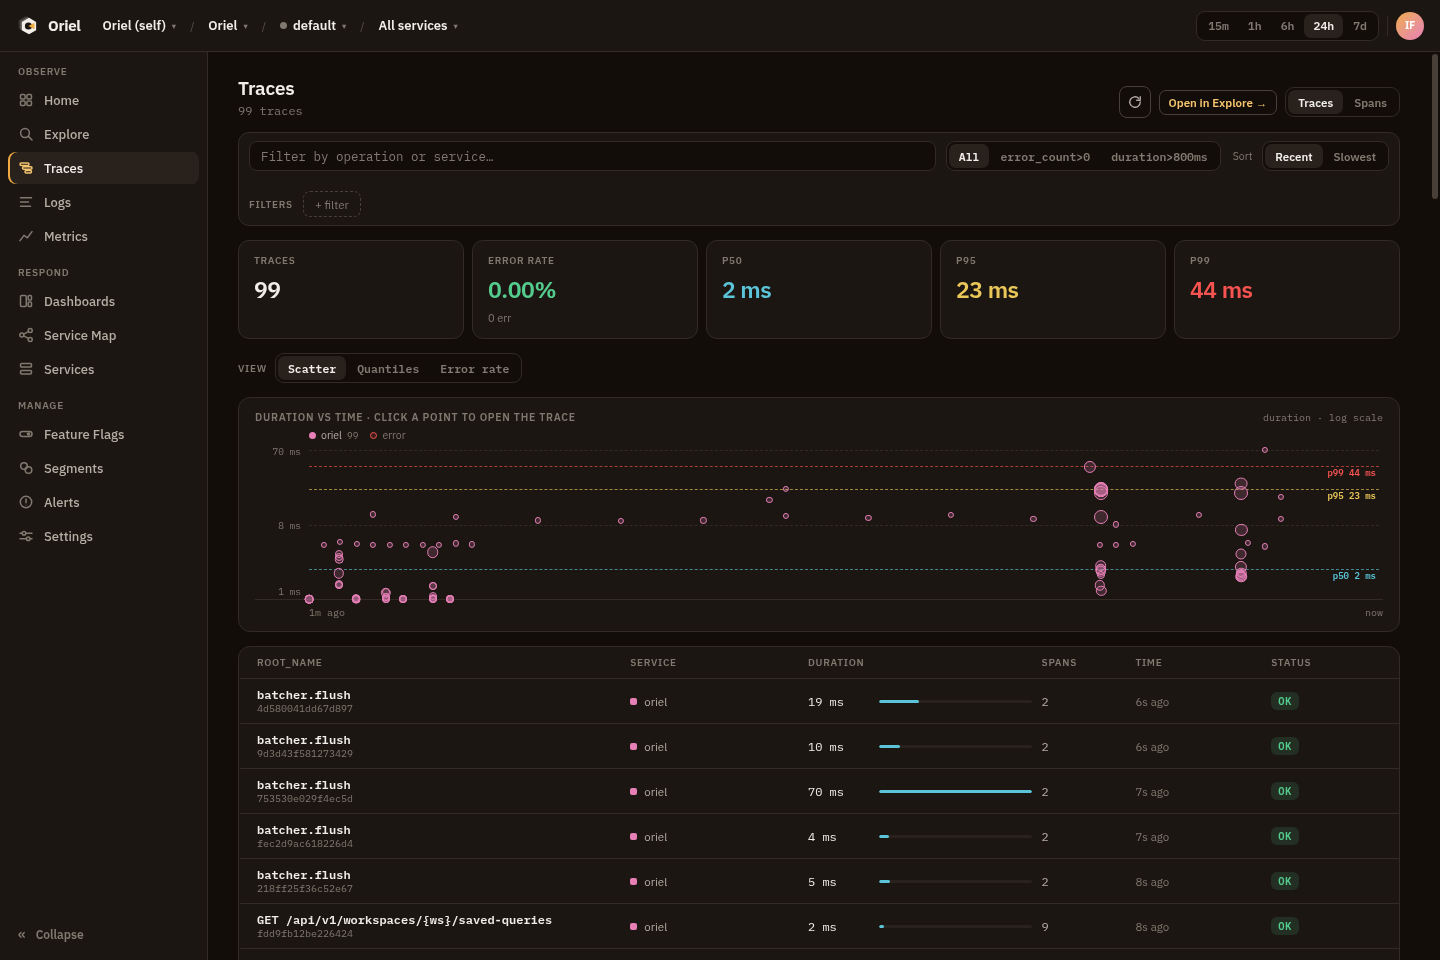
Section titled “Workflow”Open Traces after choosing scope and time range. Use the trace list for aggregate search and the trace detail page for a single waterfall.
Common queries:
traces | where error_count > 0 | sort duration desc | limit 50spans | where http.response.status_code >= 500 | stats count() by service, http.routespans | where peer.service exists | stats count() by peer.service, bin(5m)Trace detail shows span timing, service boundaries, status, attributes, resource attributes, events, links, and related logs when present.
Permissions
Section titled “Permissions”Traces require telemetry:query for the selected workspace or project.
Related Pivots
Section titled “Related Pivots”- Open logs filtered by
trace_idorspan_id. - Move from a slow route to metrics for the same service.
- Move from a service in the waterfall to the Services page or Service Map.
- Use exception or status fields as Explore predicates.